DKAN Dash: A new tool for interactive data visualizations
By Paul Walker on May 22, 2017
DKAN Dash is a cool new tool that works with DKAN to create multi-faceted data visualizations based on DKAN datasets. Some of the features include:
- Charting and Graphing with D3 (via NVD3)
- Choropleth Maps
- User filters to interact with data
- Custom layouts with Bootstrap responsive grid
- Metric and Goal components for visually compelling presentations of simple statistics
- Lots more!
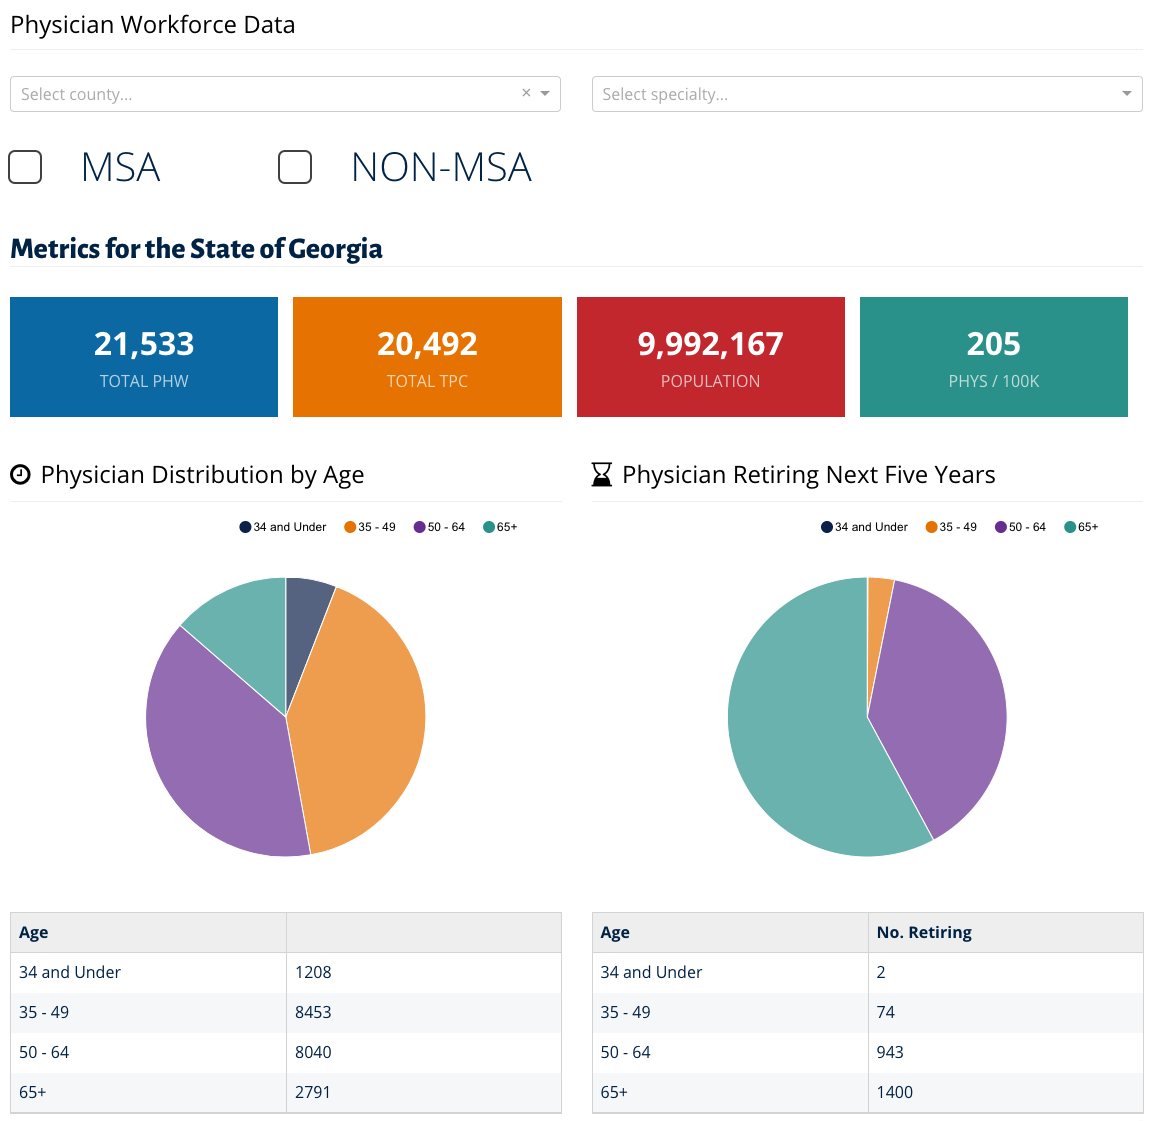
As an example of what you might get from wiring it all up, here is a screenshot from a recent project for the Georgia Board for Physician Workforce:

Changing the filter values at the top will reload the data – and, in some cases, change the layout – of the visualizations below them.
Who DKAN Dash Is For
We built DKAN Dash as a way to do complex custom data visualization dashboards in a repeatable way using DKAN’s Datastore API as a data backend. DKAN Dash and its supporting ecosystem are really a development framework that allows for highly customizable data visualizations while minimizing boilerplate code and unnecessary repetition.
DKAN Dash is a tool that has been fine-tuned to the needs of developers – Javascript developers in particular, although if you can write JSON you can go far. It does help to have an understanding of current Javascript trends and practices, including such nuggets as React, ES2015, NPM and Javascript package management, etc. That said, we are working hard to lower barriers to entry.
How It Works
Under the hood DKAN Dash consists of a number of major components:
React Dash
React Dash is an open-source library (built with – yes – React) that supports the basic functionality of DKAN Dash: charting, mapping, metrics and filtering. As anyone who has worked extensively with JavaScript knows, it’s libraries all the way down – we use Bootstrap to easily handle responsive layouts, D3 and NVD3 as charting engines, as well as a host of smaller libraries.
The definitive feature of React Dash is its configuration-based architecture. An entire dashboard can be created using a declarative configuration object (essentially a large JSON file with a well-documented schema).
For instance, this dashboard is built from this configuration file.
Datastore API
Not to be confused with the Dataset REST API, the Datastore API uses a simple POST interface to return filtered data from Dataset resources in DKAN.
DKAN Dash Javascript Application
The JS app is a thin wrapper around the React Dash library. It provides an interface to Drupal’s global JavaScript object, and provides a model layer that can convert defined queries (in the settings file) and user-applied filters into valid queries against the DKAN Datastore API, which are then used the populate the dashboard.
Drupal Module
The Drupal module provides a Dashboard content type where dashboard settings are stored as JSON. The module also provides basic Drupal routing, permissions, etc. When the dashboard page is visited, the DKAN Dash Javascript application is embedded in the page and passed the configuration settings from the entity.
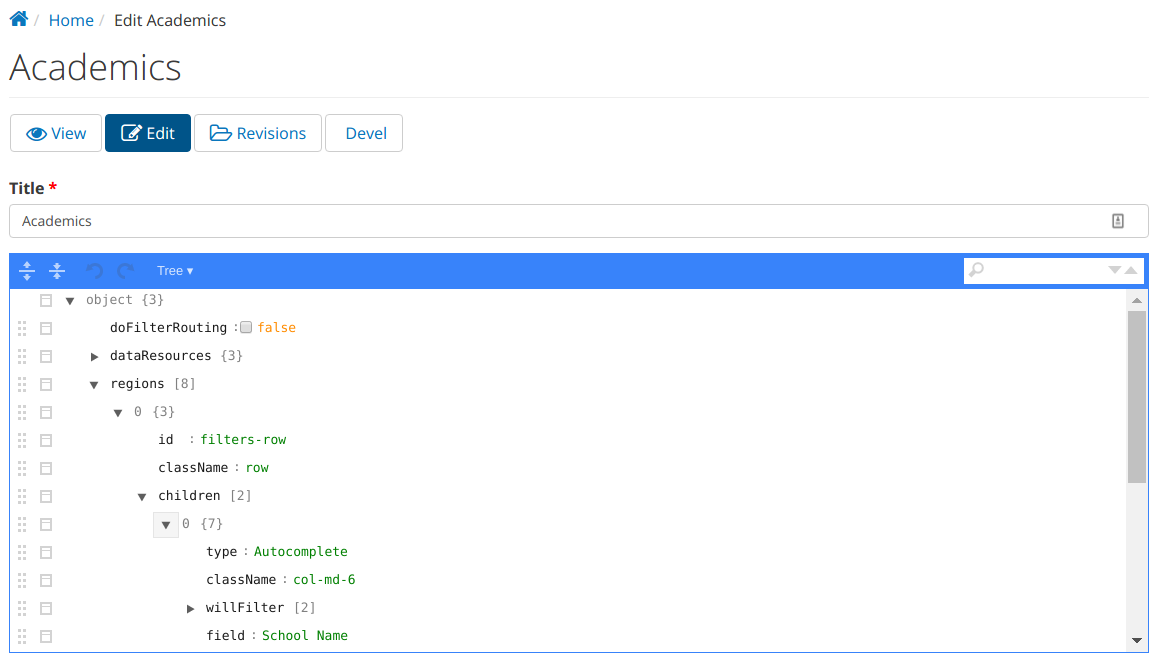
The modules also provides a browser-based JSON editor to make modifying dashboard configurations easier:

Custom Implementation Module
In addition to the settings object, which is stored in the database, the DKAN Dash Javascript app can load custom handling functions, css, and other code from a custom, project-specific module. While most of any DKAN Dash implementation lives in the configuration object, the ability to add custom code here allows developers to preprocess their data for consumption by the dashboard components. An example can be seen here.
Where it’s Going
The future of DKAN Dash and its underlying libraries is bright. As we continue to roll out dashboard implementations the list of features grows, and the stability and performance of the platform continues to improve. While development at this point is being driven by immediate project requirements, there are some big things brewing:
Dashboard Creation - UX
Currently, in order to generate the dashboard pages you need to speak Javascript - or at least JSON. We are looking forward to the day, however, when less technical users can use an graphical interface to generate visualizations related to their DKAN data.
Additional components
Under development we have:
- Slideshows
- Accordion-style expanding and collapsing of layout regions
- Real-time updates with websockets